Resume Websites

Jordan RiveraOperations Data Analyst

Experience
4+ years in analytics
Currently
Copperline Services
Based in
Phoenix, AZ
Education
B.S. Statistics
  • SQL
  • Python
  • Power BI
  • Excel
  • Tableau

Experience

Four years turning messy operations data into dashboards and tools that people actually use.

Senior Operations Analyst

Copperline Services · Phoenix, AZ

Mar 2025 – Present

  • Built the weekly service dashboard that 40 site managers now use instead of emailed spreadsheets.
  • Automated a monthly report in Python, cutting it from two days of work to 20 minutes.
  • Set up data checks that catch duplicate and missing records before they reach leadership.

Operations Analyst

Copperline Services · Phoenix, AZ

Jun 2023 – Mar 2025

  • Owned vendor scorecards for 120 service contracts across three regions.
  • Rebuilt the client survey process so results arrive in days instead of weeks.

Data Analyst Intern

Desert Valley Health · Tempe, AZ

Jan 2023 – May 2023

  • Cleaned five years of scheduling data and built a no-show report for clinic managers.

Student Data Assistant

University Housing Office · Tempe, AZ

Aug 2021 – Dec 2022

  • Tracked move-in requests for 3,000 students in Excel and built the weekly summary.

Dashboards & Data

Dashboards I've built, and data before and after I cleaned it up.

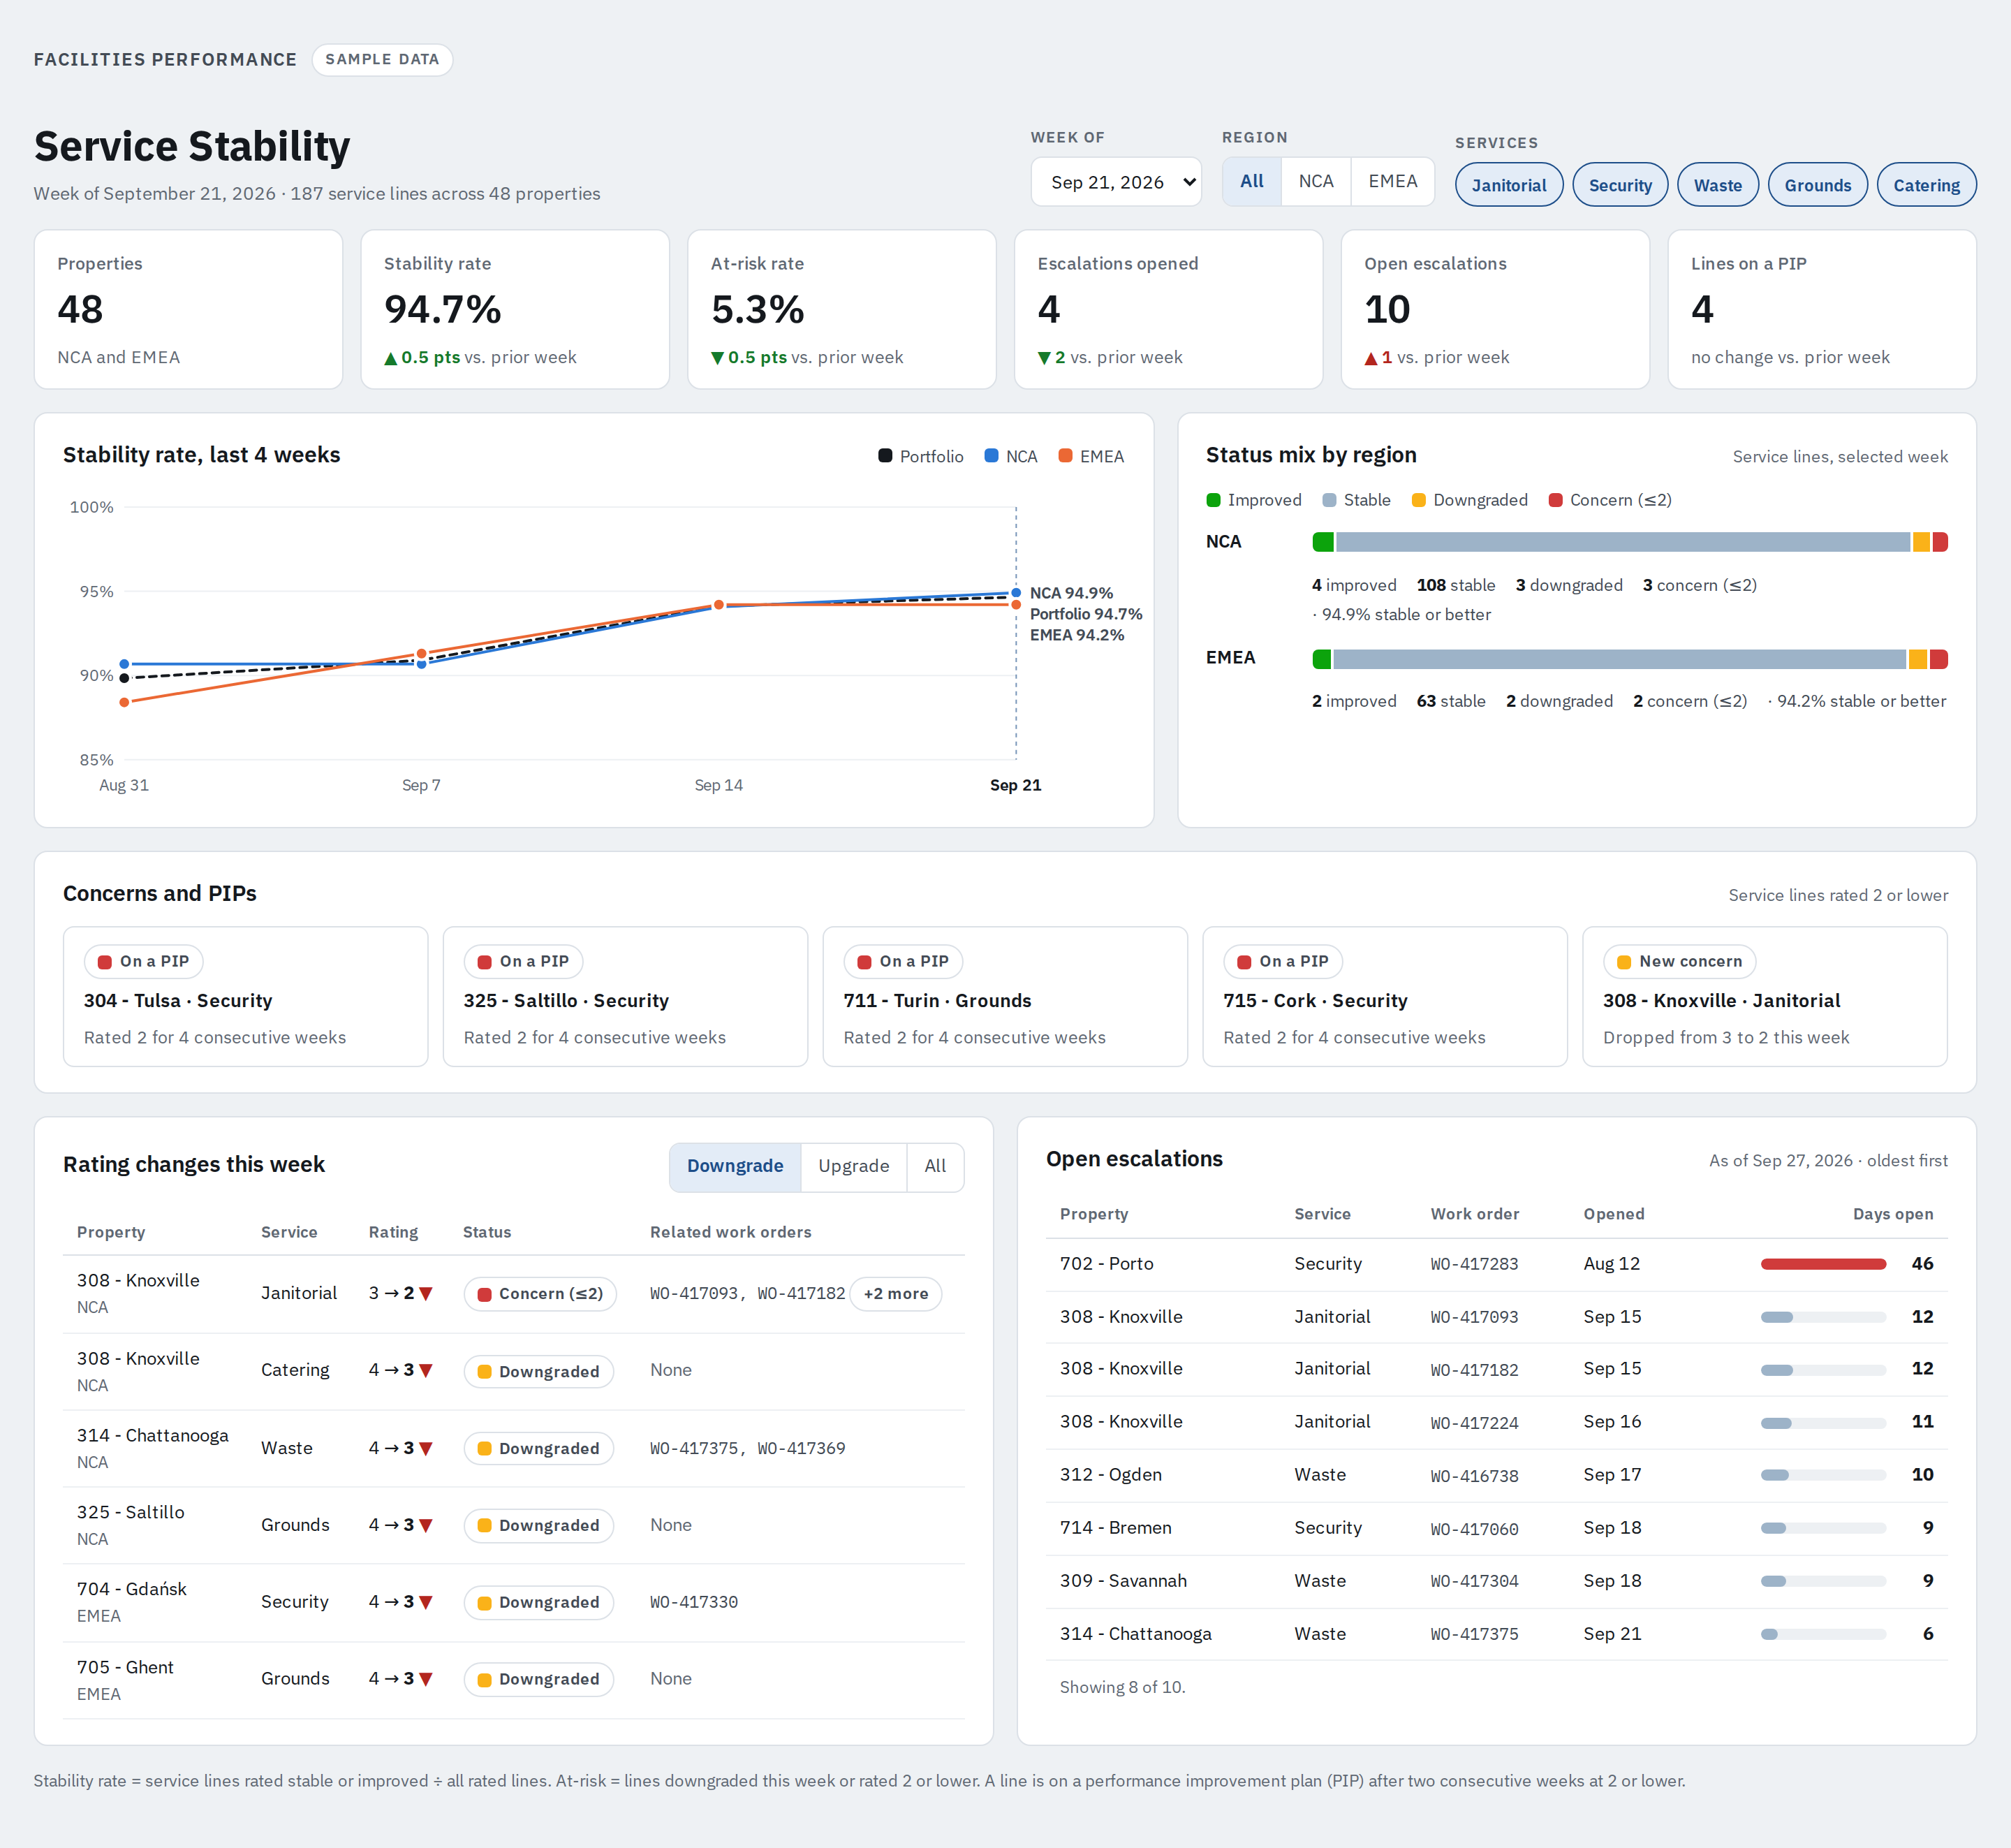
Service Stability dashboard with sample data: KPI cards, a four-week trend by region, status mix by region, and tables of rating changes and open escalations.
Service StabilityWeekly service ratings, escalations and improvement plans across every site. Sample data.
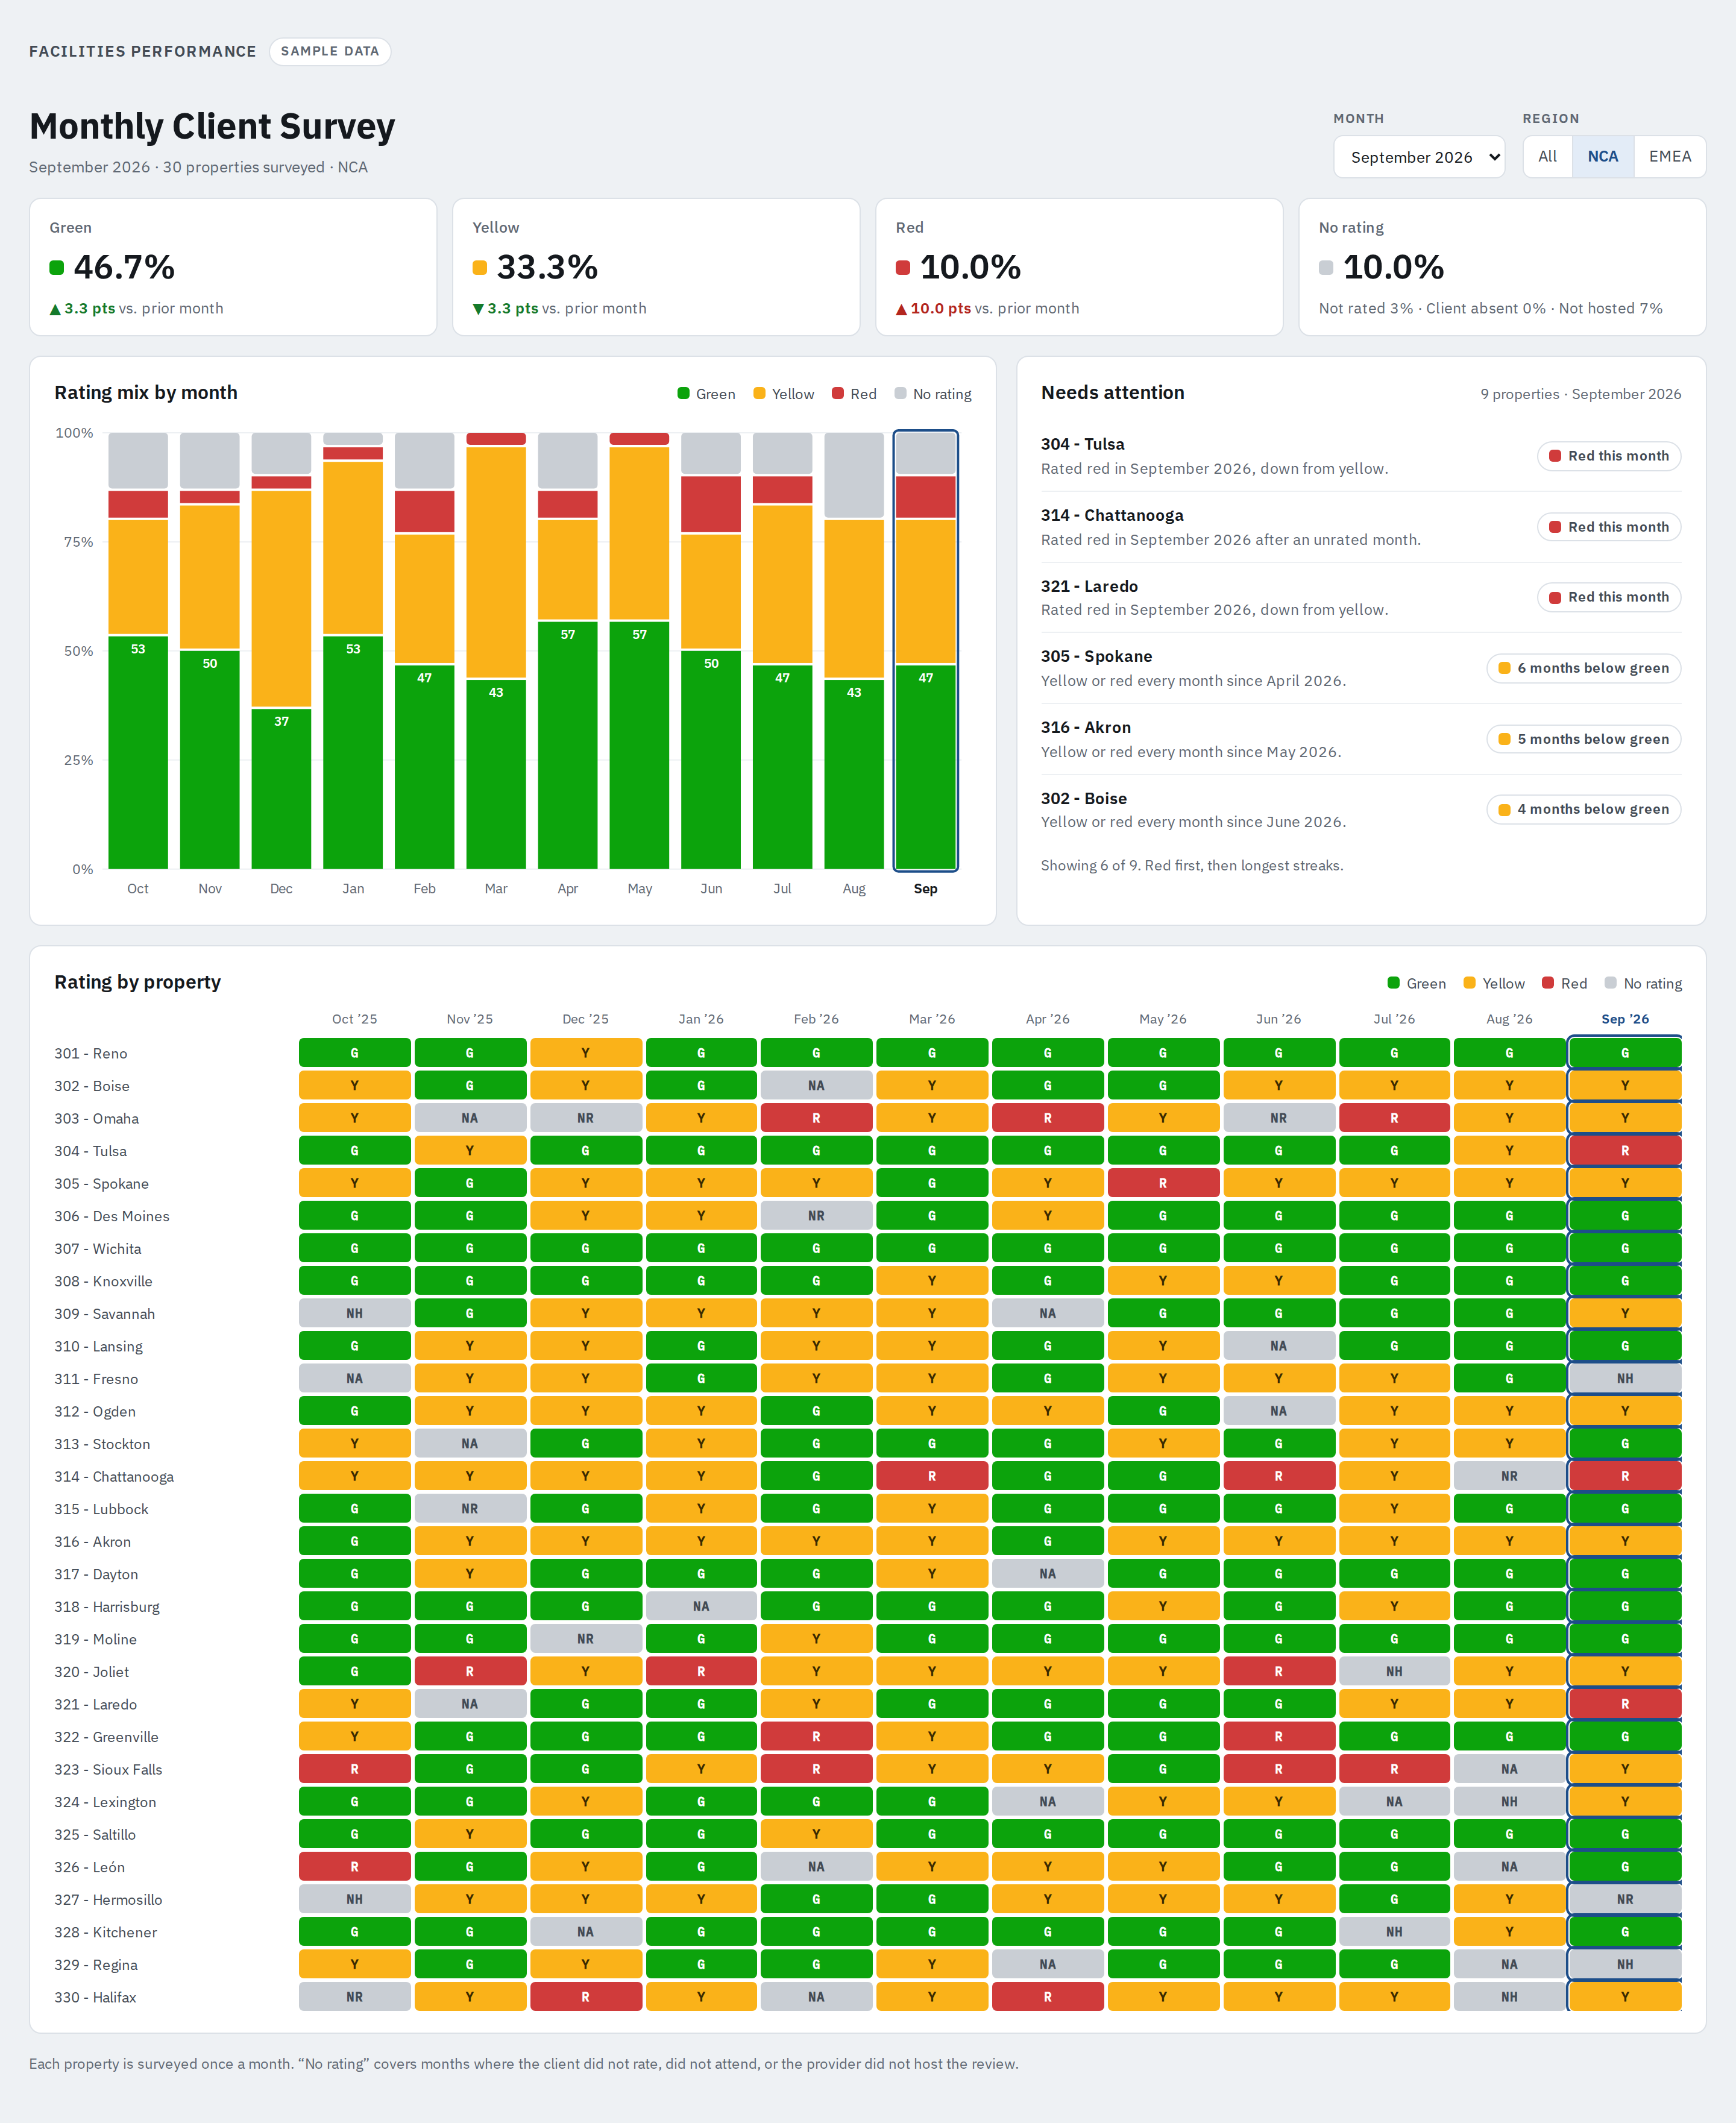
Monthly Client Survey dashboard with sample data: rating shares, a twelve-month rating mix chart, a needs-attention list and a month-by-month rating grid.
Monthly Client SurveyClient ratings by site each month, with the sites that need attention first. Sample data.
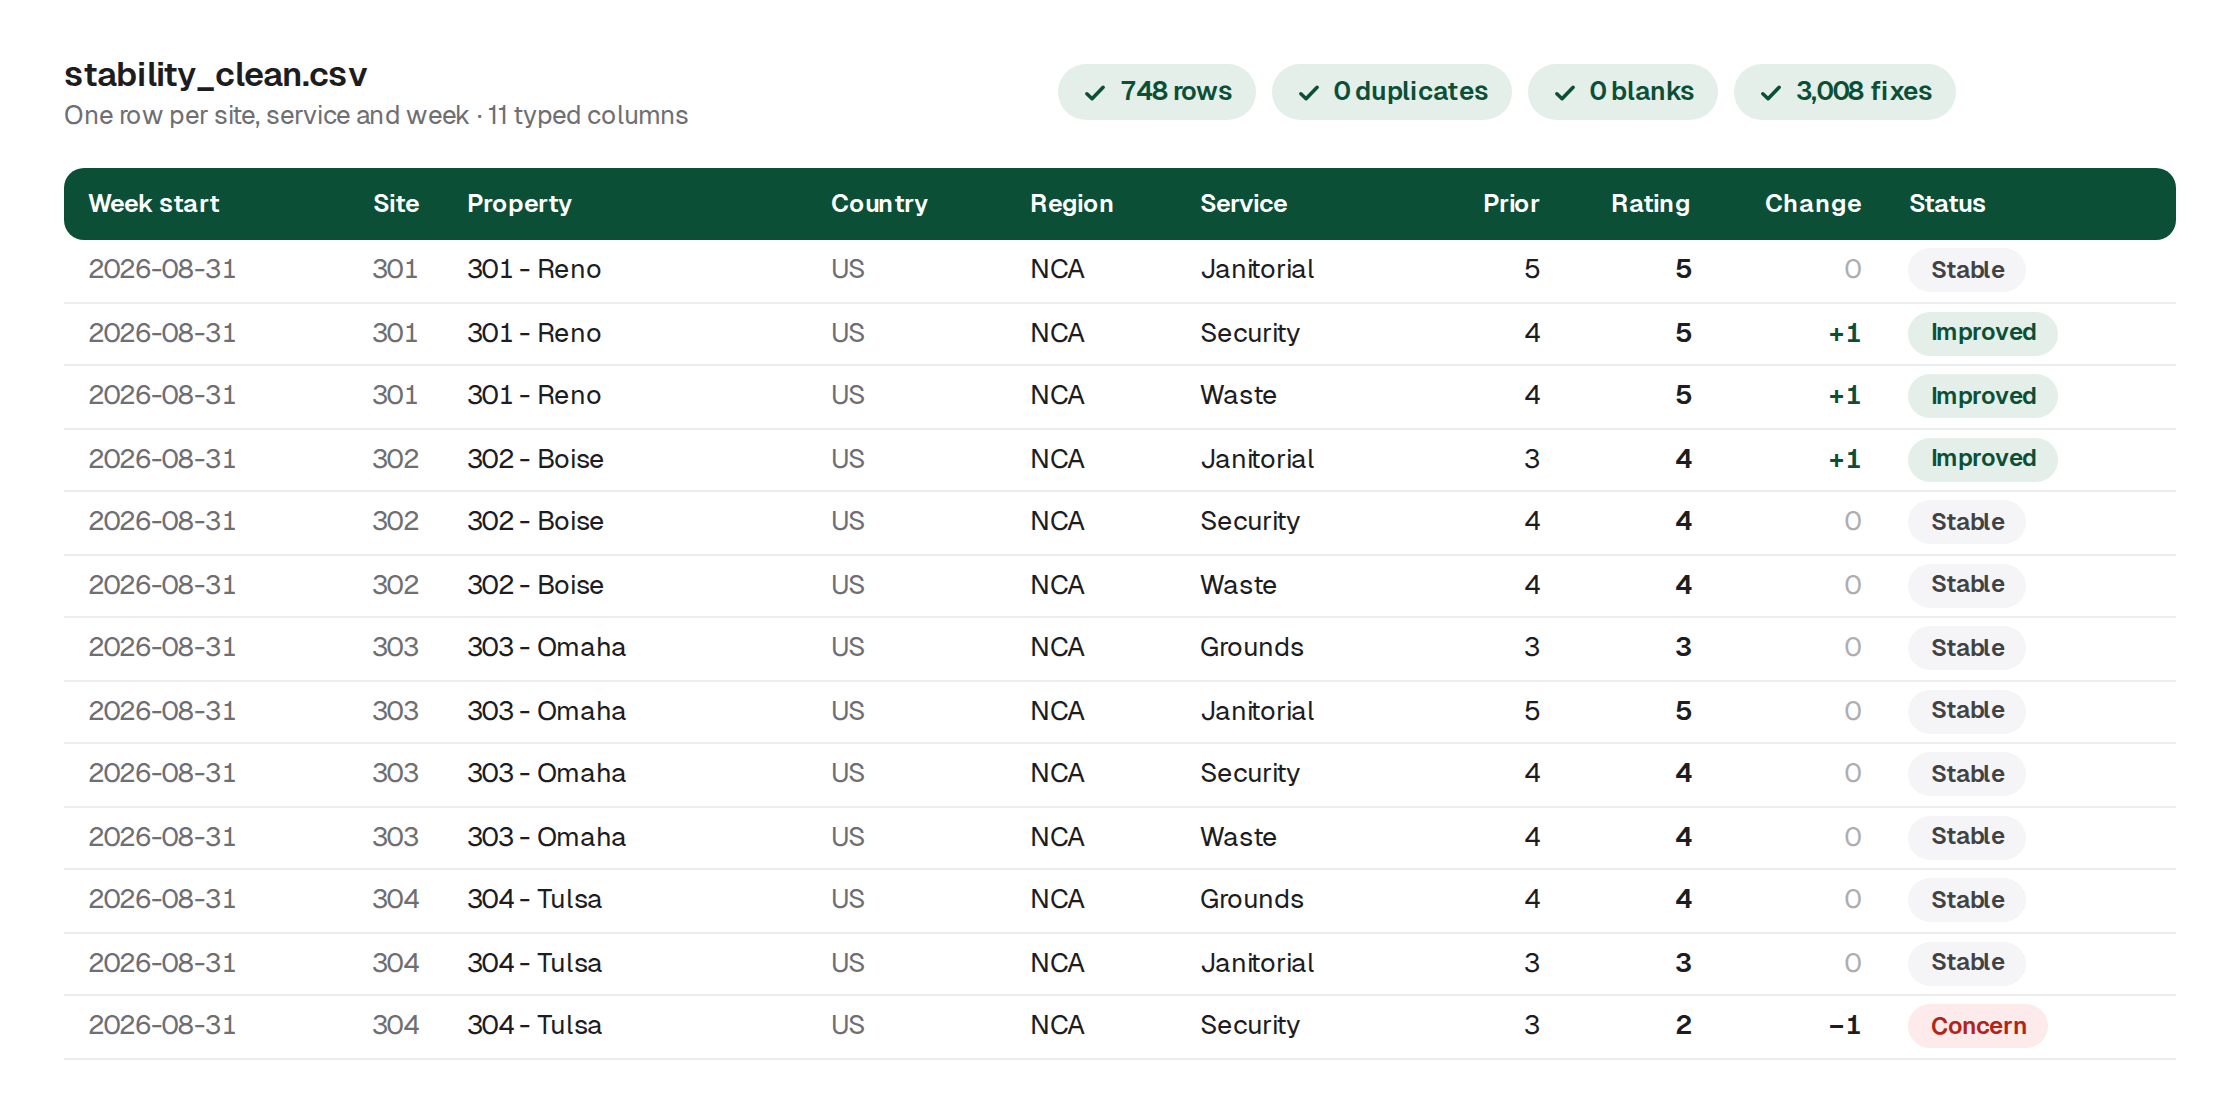
After: a clean table with one row per site, service and week, consistent dates, names and ratings.
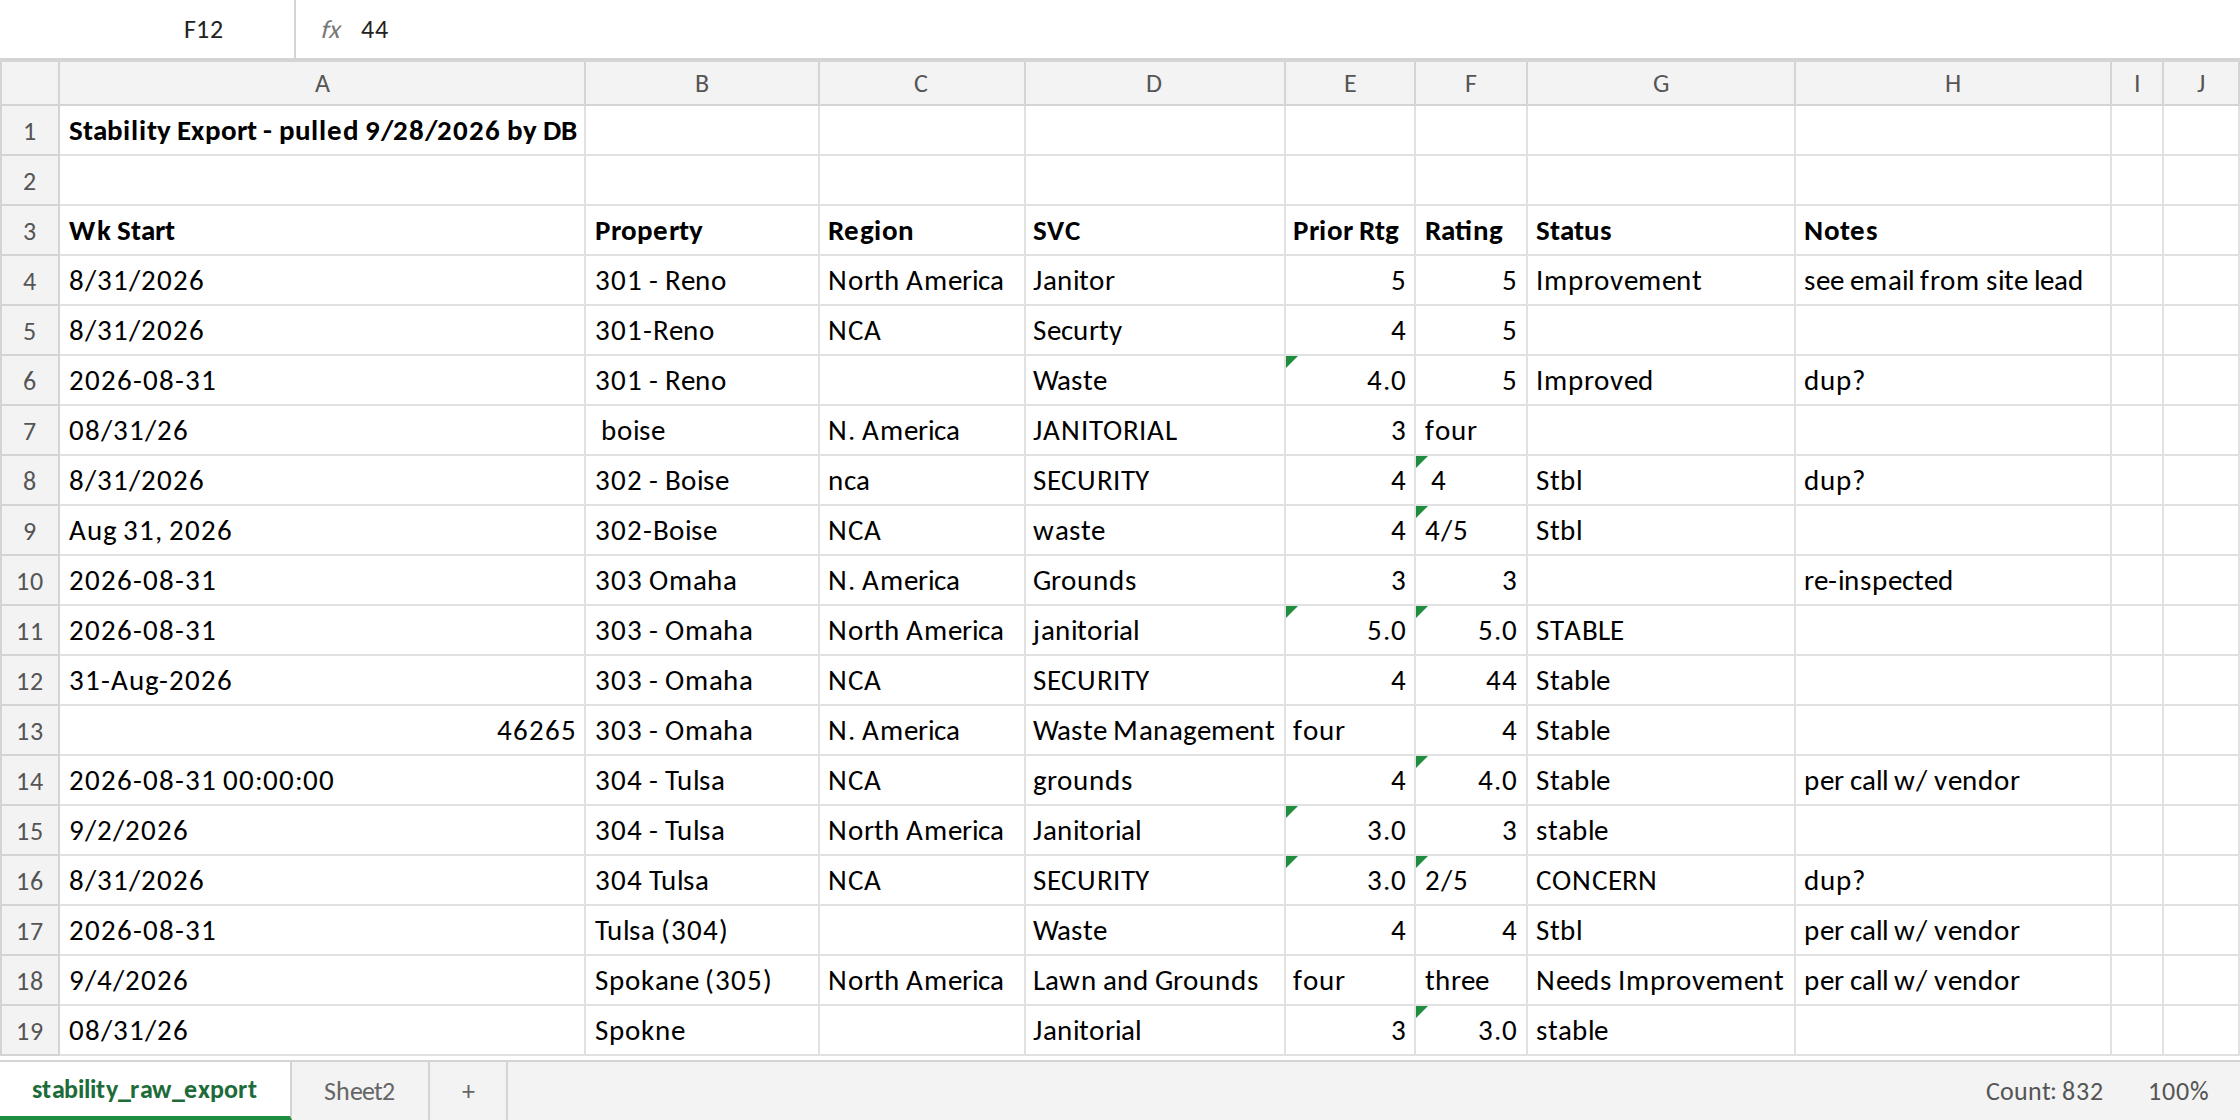
Before: a raw spreadsheet export with mixed date formats, duplicate rows, inconsistent names and ratings typed as words.
Before After
Spreadsheet cleanupA raw export, cleaned into one consistent row per site, service and week. Drag to compare.

Selected projects

Two projects, each with the problem, the build and the result.

Problem
A leadership report took two analysts two days to build by hand every month.
What I built
A Python script that pulls the data, runs the checks and fills the report template on its own.
Result
The report now takes 20 minutes, and the numbers no longer change between drafts.
  • Python
  • SQL
  • Excel
Problem
Site managers had no shared way to compare 120 vendors, so renewals came down to opinion.
What I built
One Power BI scorecard with the same five measures for every vendor, refreshed weekly.
Result
Renewal reviews now start from the scorecard, and two underperforming contracts were replaced.
  • Power BI
  • SQL

Education

B.S. in Statistics

Arizona State University

Class of May 2023

  • Dean's List
  • Undergraduate Research Fellow

Let's talk about your data.

I'm open to analytics roles in Phoenix or remote. Email is the fastest way to reach me.

Classic style · sample site See your site in this style →