I measure what buildings use and waste, then turn it into plans that cut both. Seven years from field work to the dashboards leaders check every week.
7+years of work, start to now
4roles
3employers
Right now
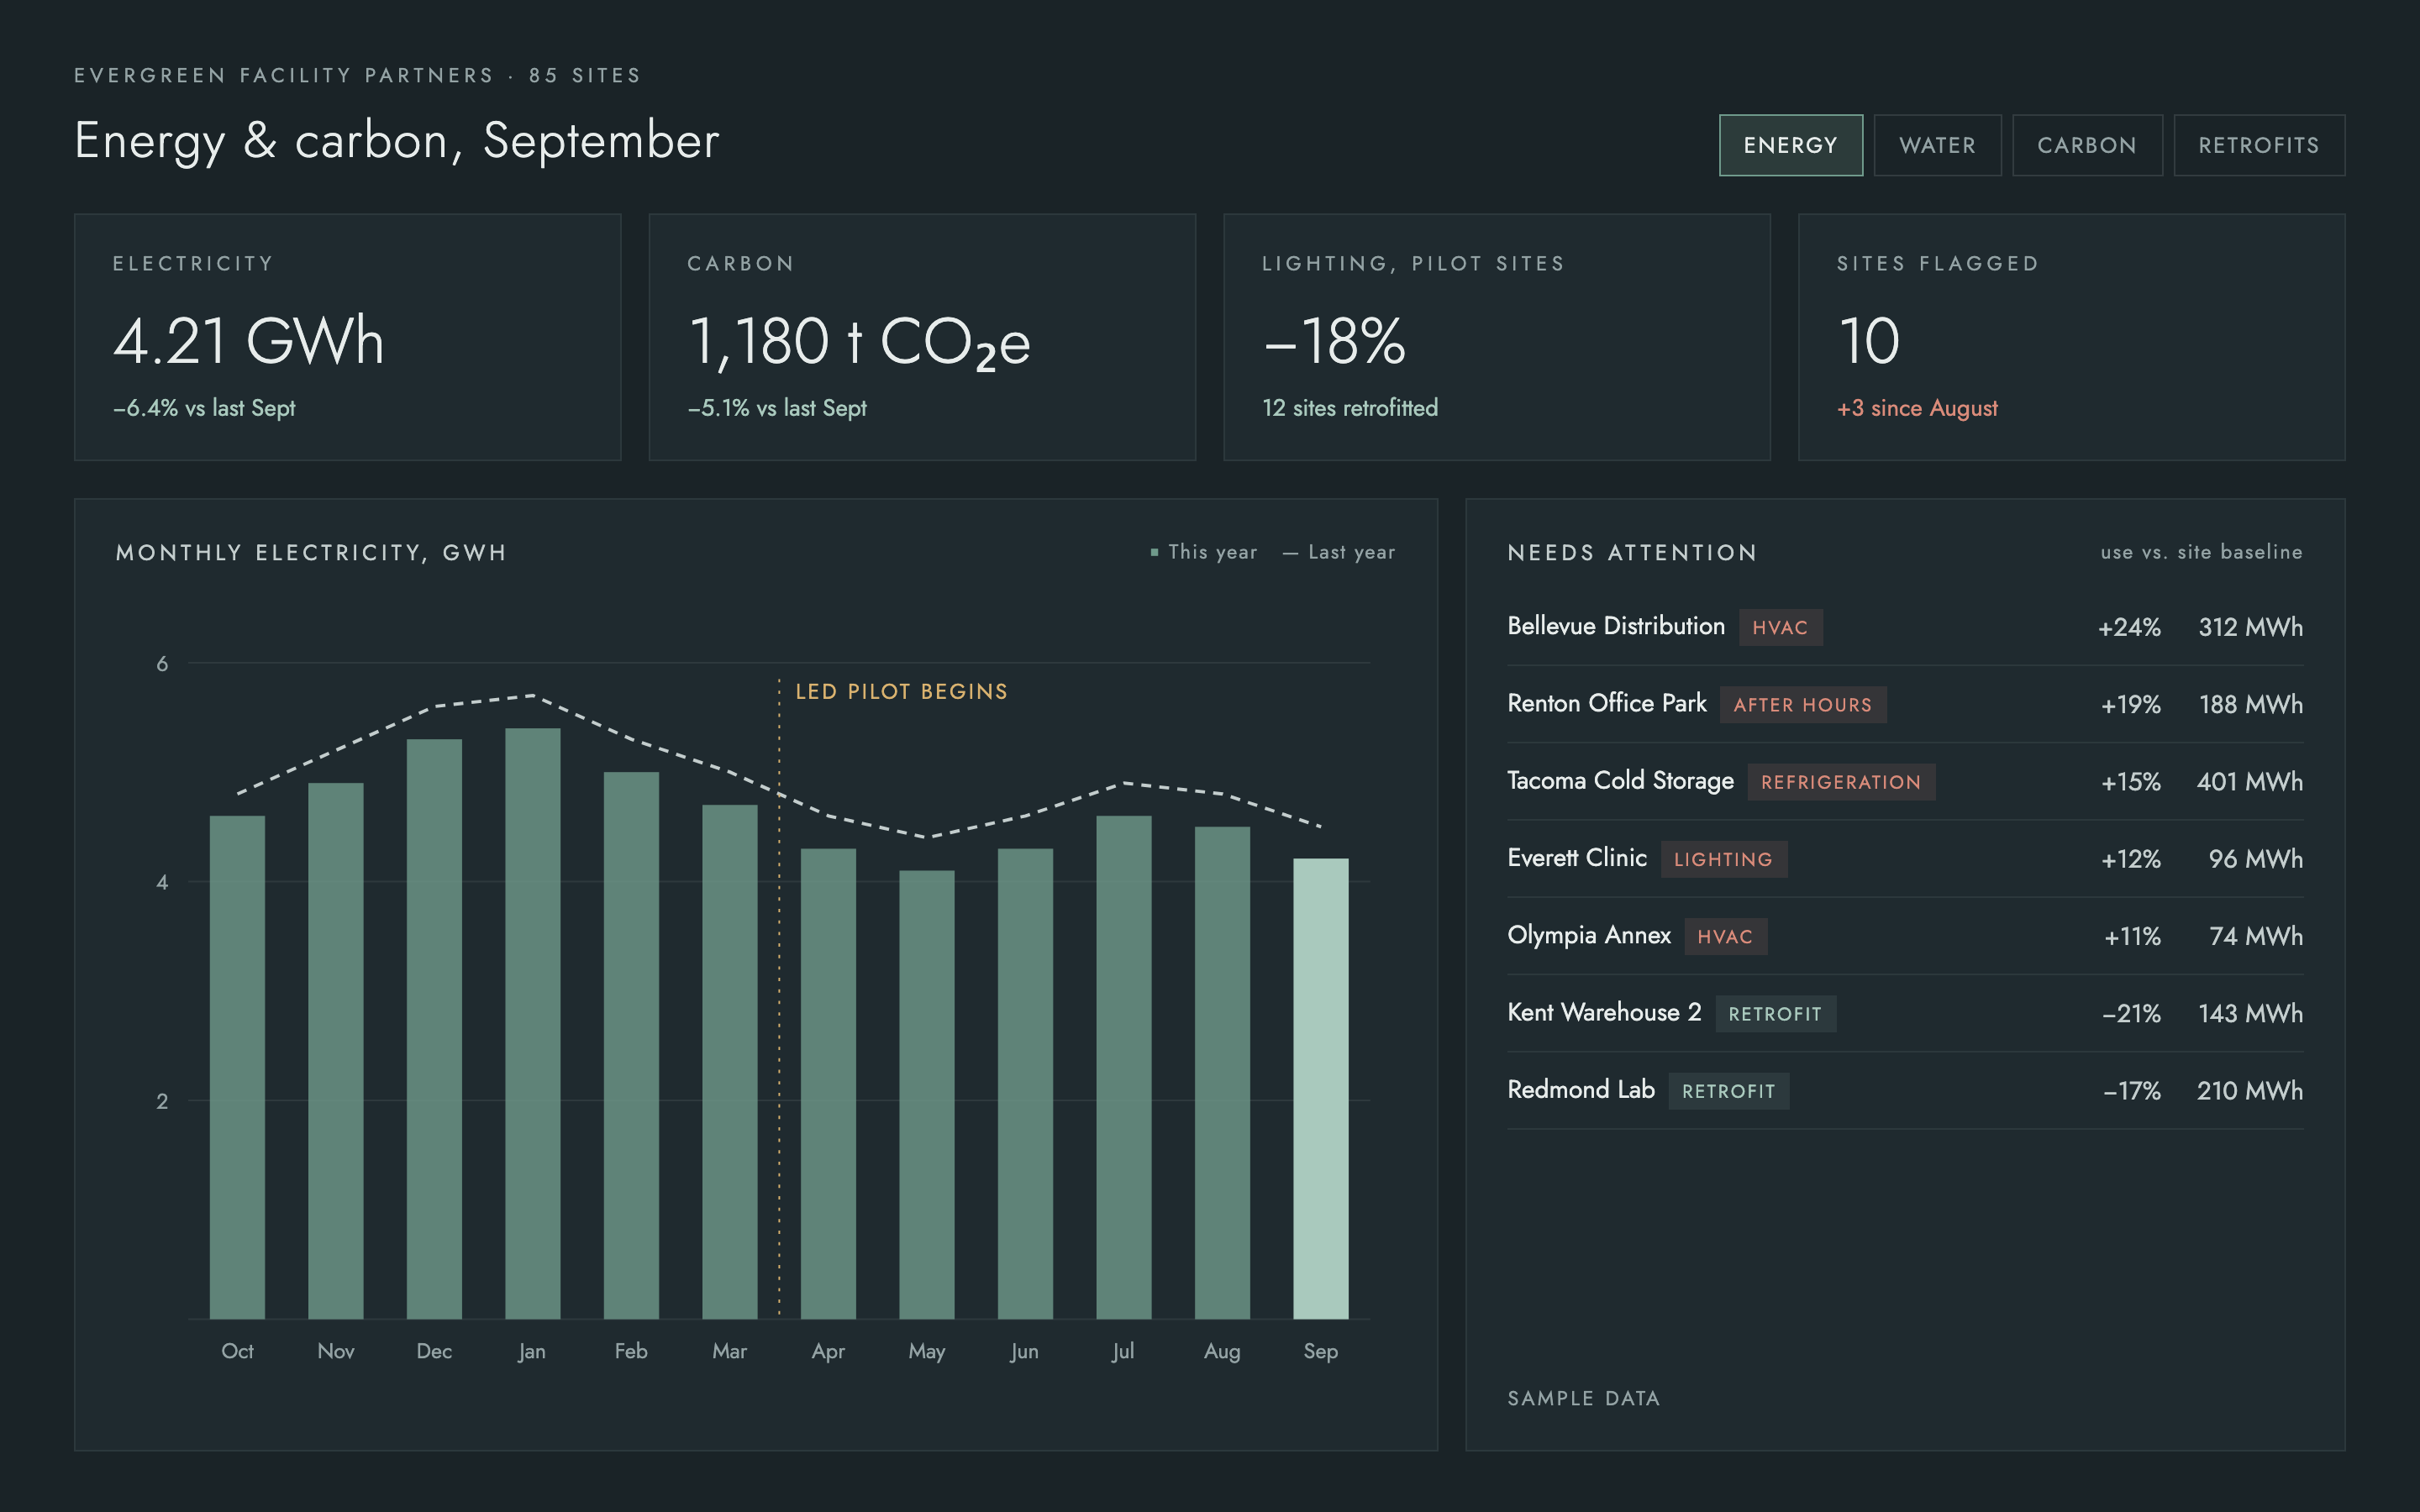
Sustainability Analyst, Evergreen Facility Partners. Track energy and water use across 85 sites and flag the ten that need attention each month.
Experience
The climb
04Field Research Assistant03GIS Technician02Operations Analyst01Sustainability Analyst
Mar 2024 – Present
Sustainability Analyst
Evergreen Facility Partners · Seattle, WA
Track energy and water use across 85 sites and flag the ten that need attention each month.
Built the weekly service dashboard that site managers use in place of emailed spreadsheets.
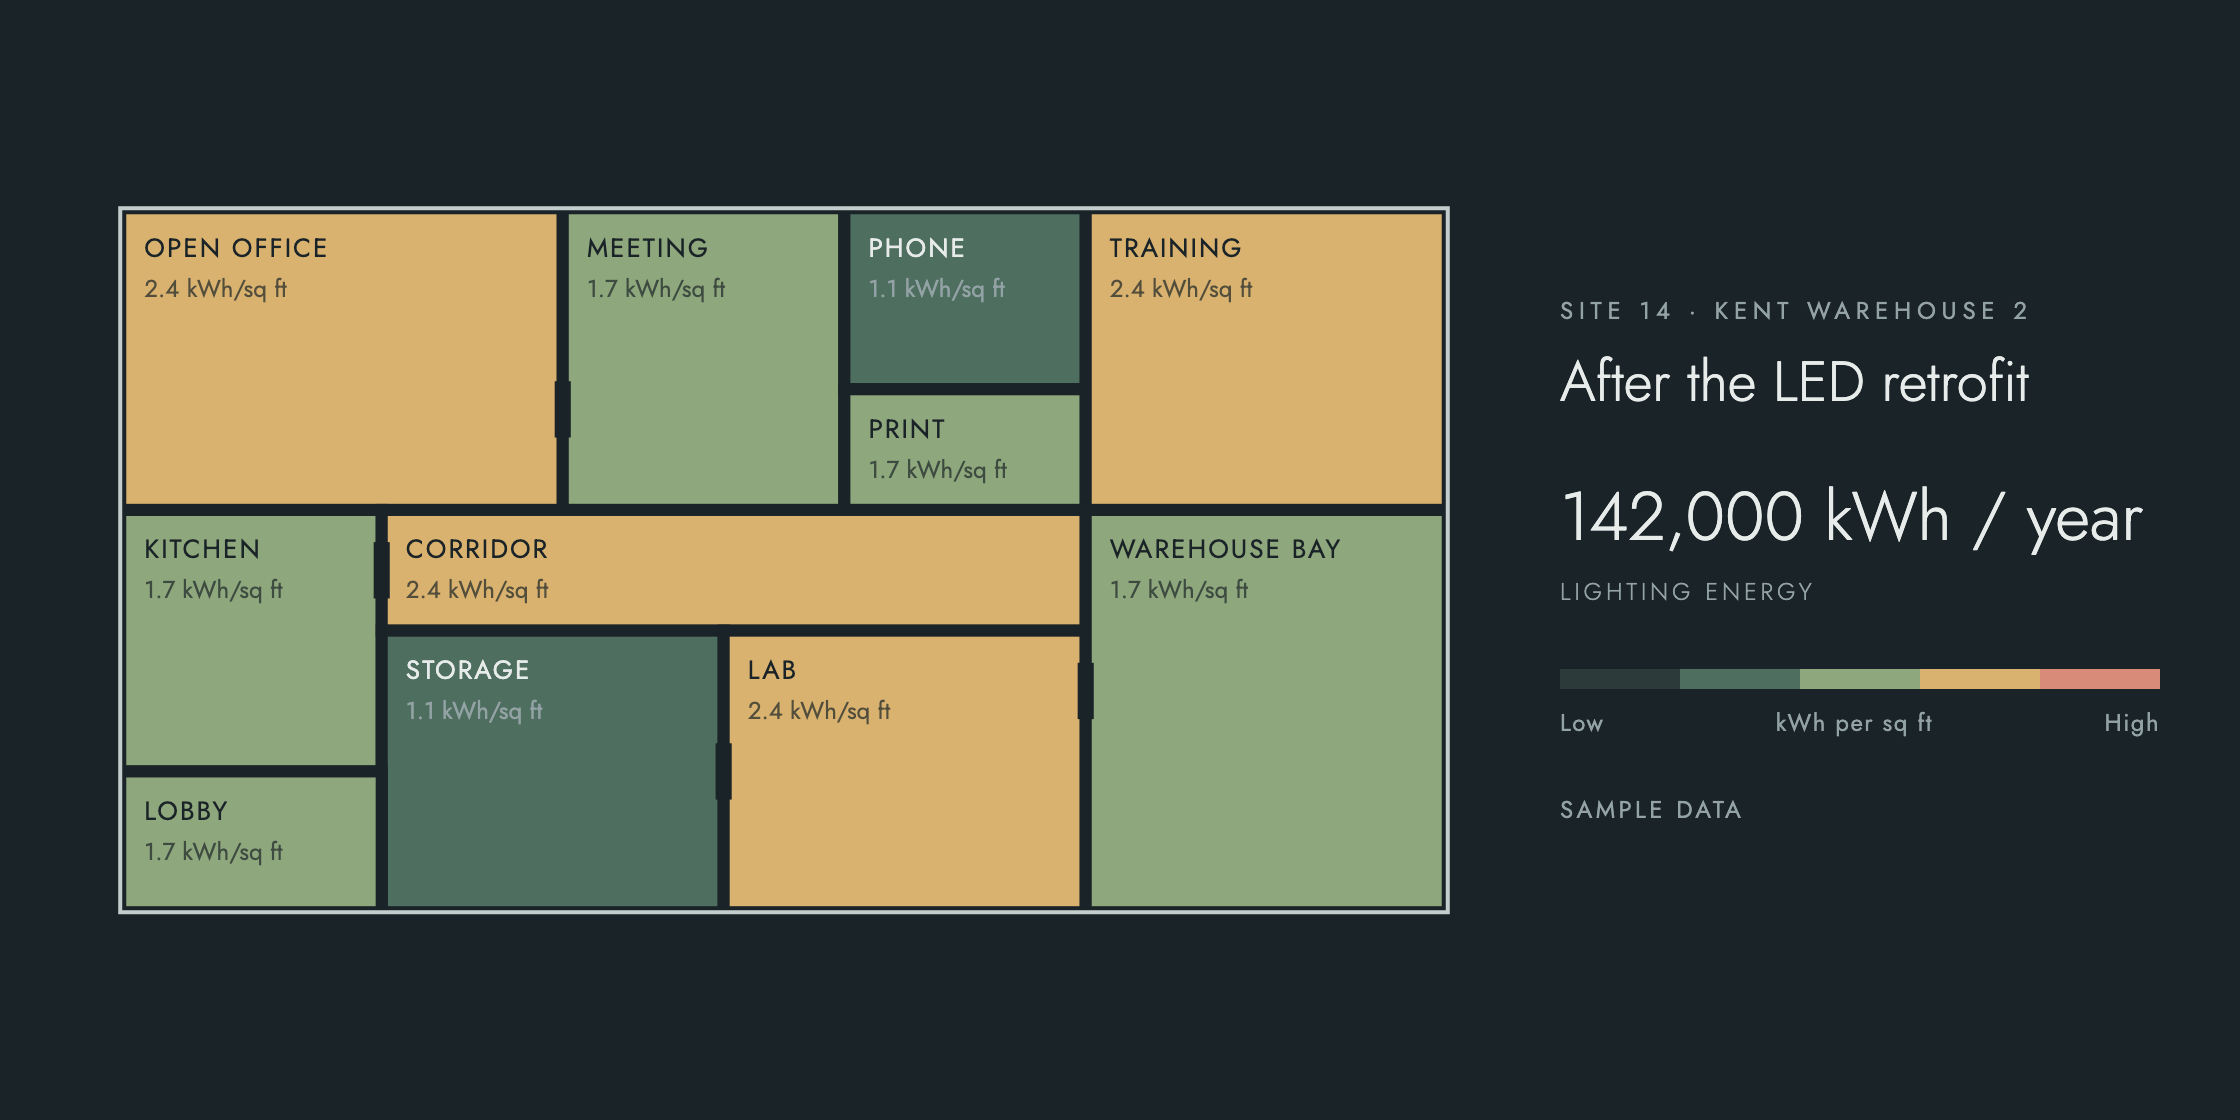
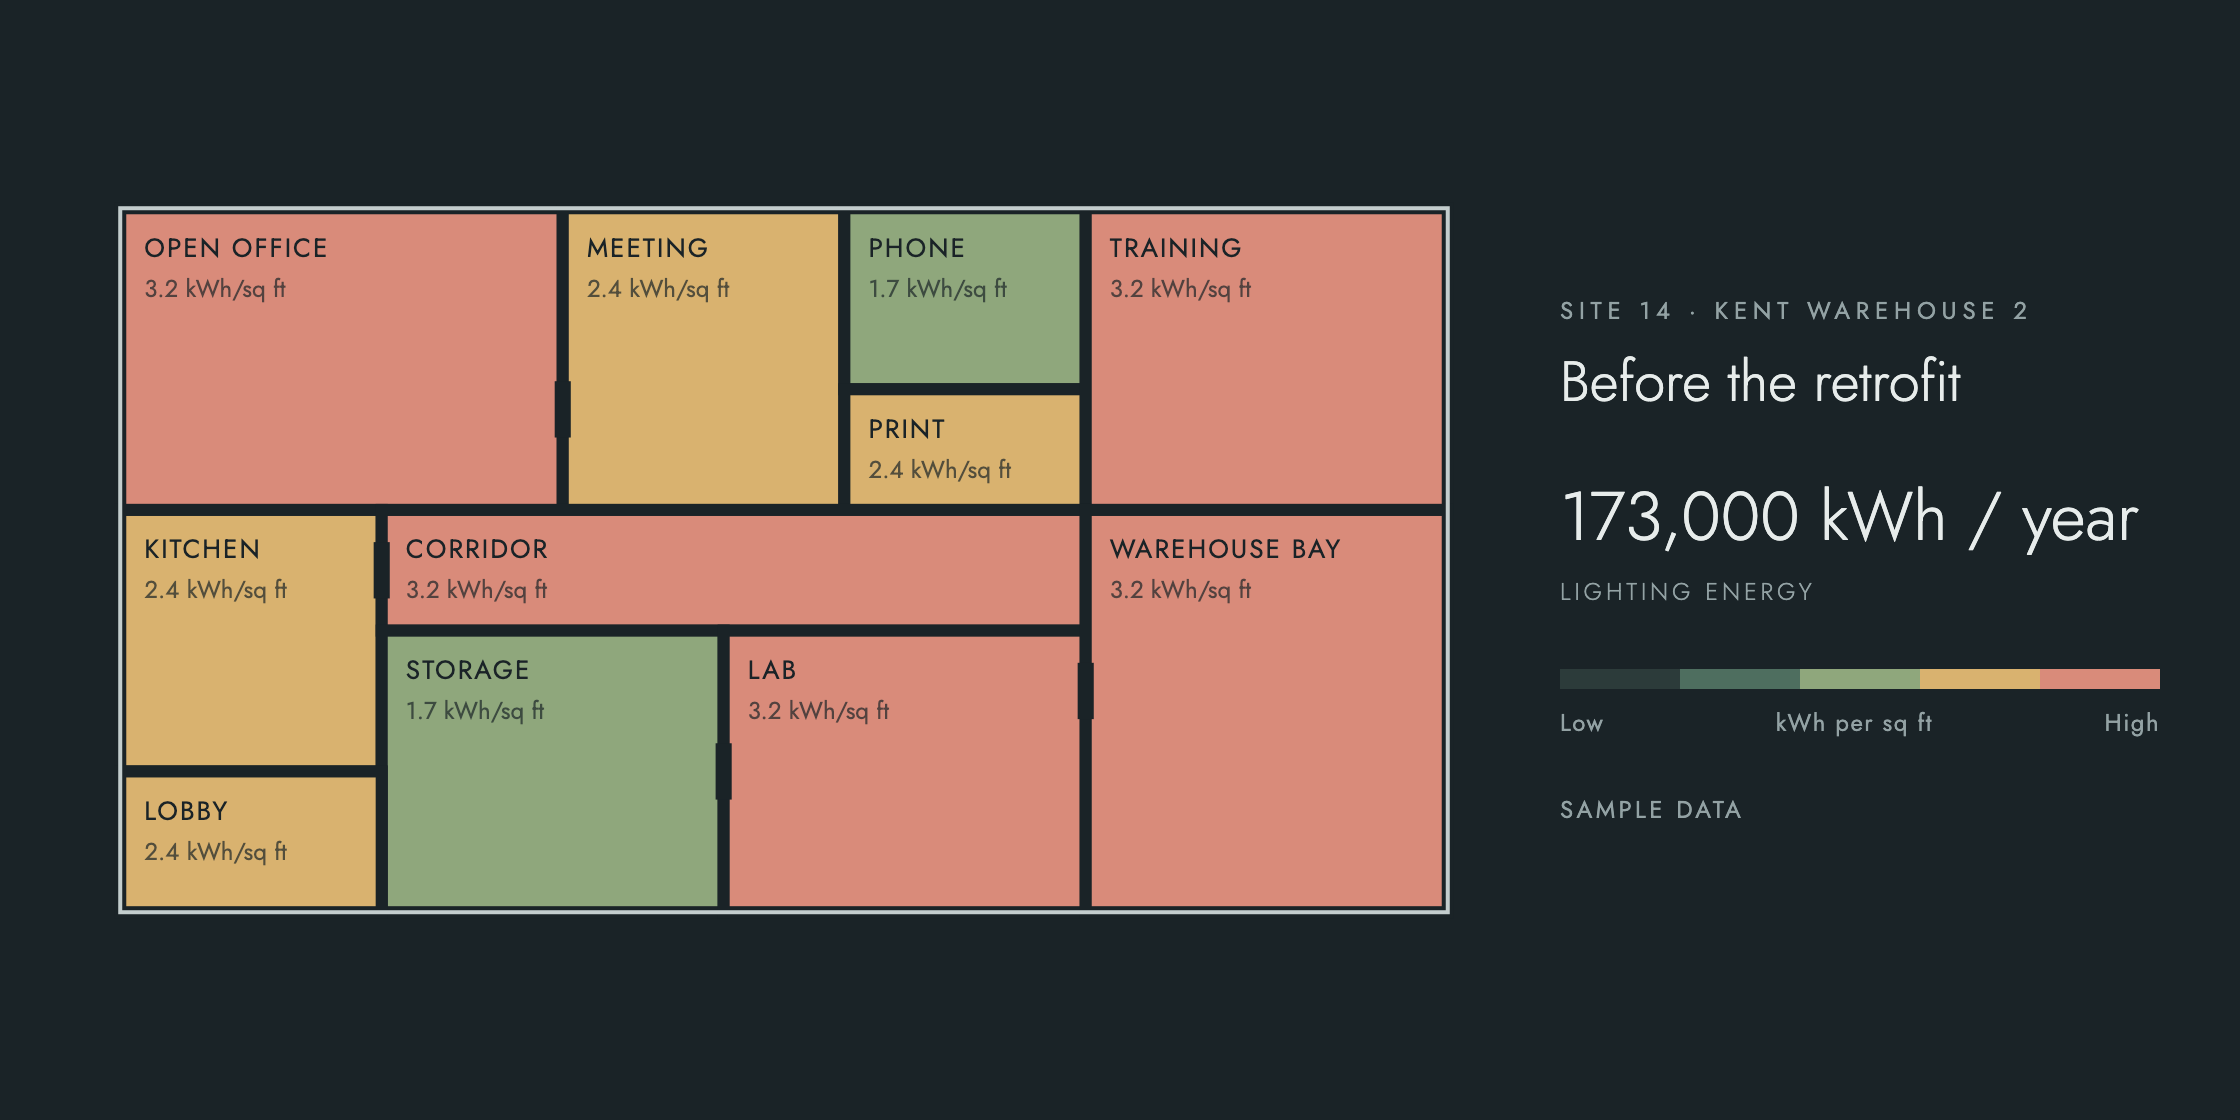
Led the retrofit study that cut lighting energy 18% at the first twelve sites.
Jun 2022 – Mar 2024
Operations Analyst
Evergreen Facility Partners · Seattle, WA
Rebuilt the client survey so results arrive in days instead of weeks.
Cleaned five years of work-order data into one table the whole team trusts.
Aug 2020 – May 2022
GIS Technician
Cascade Land Trust · Bellingham, WA
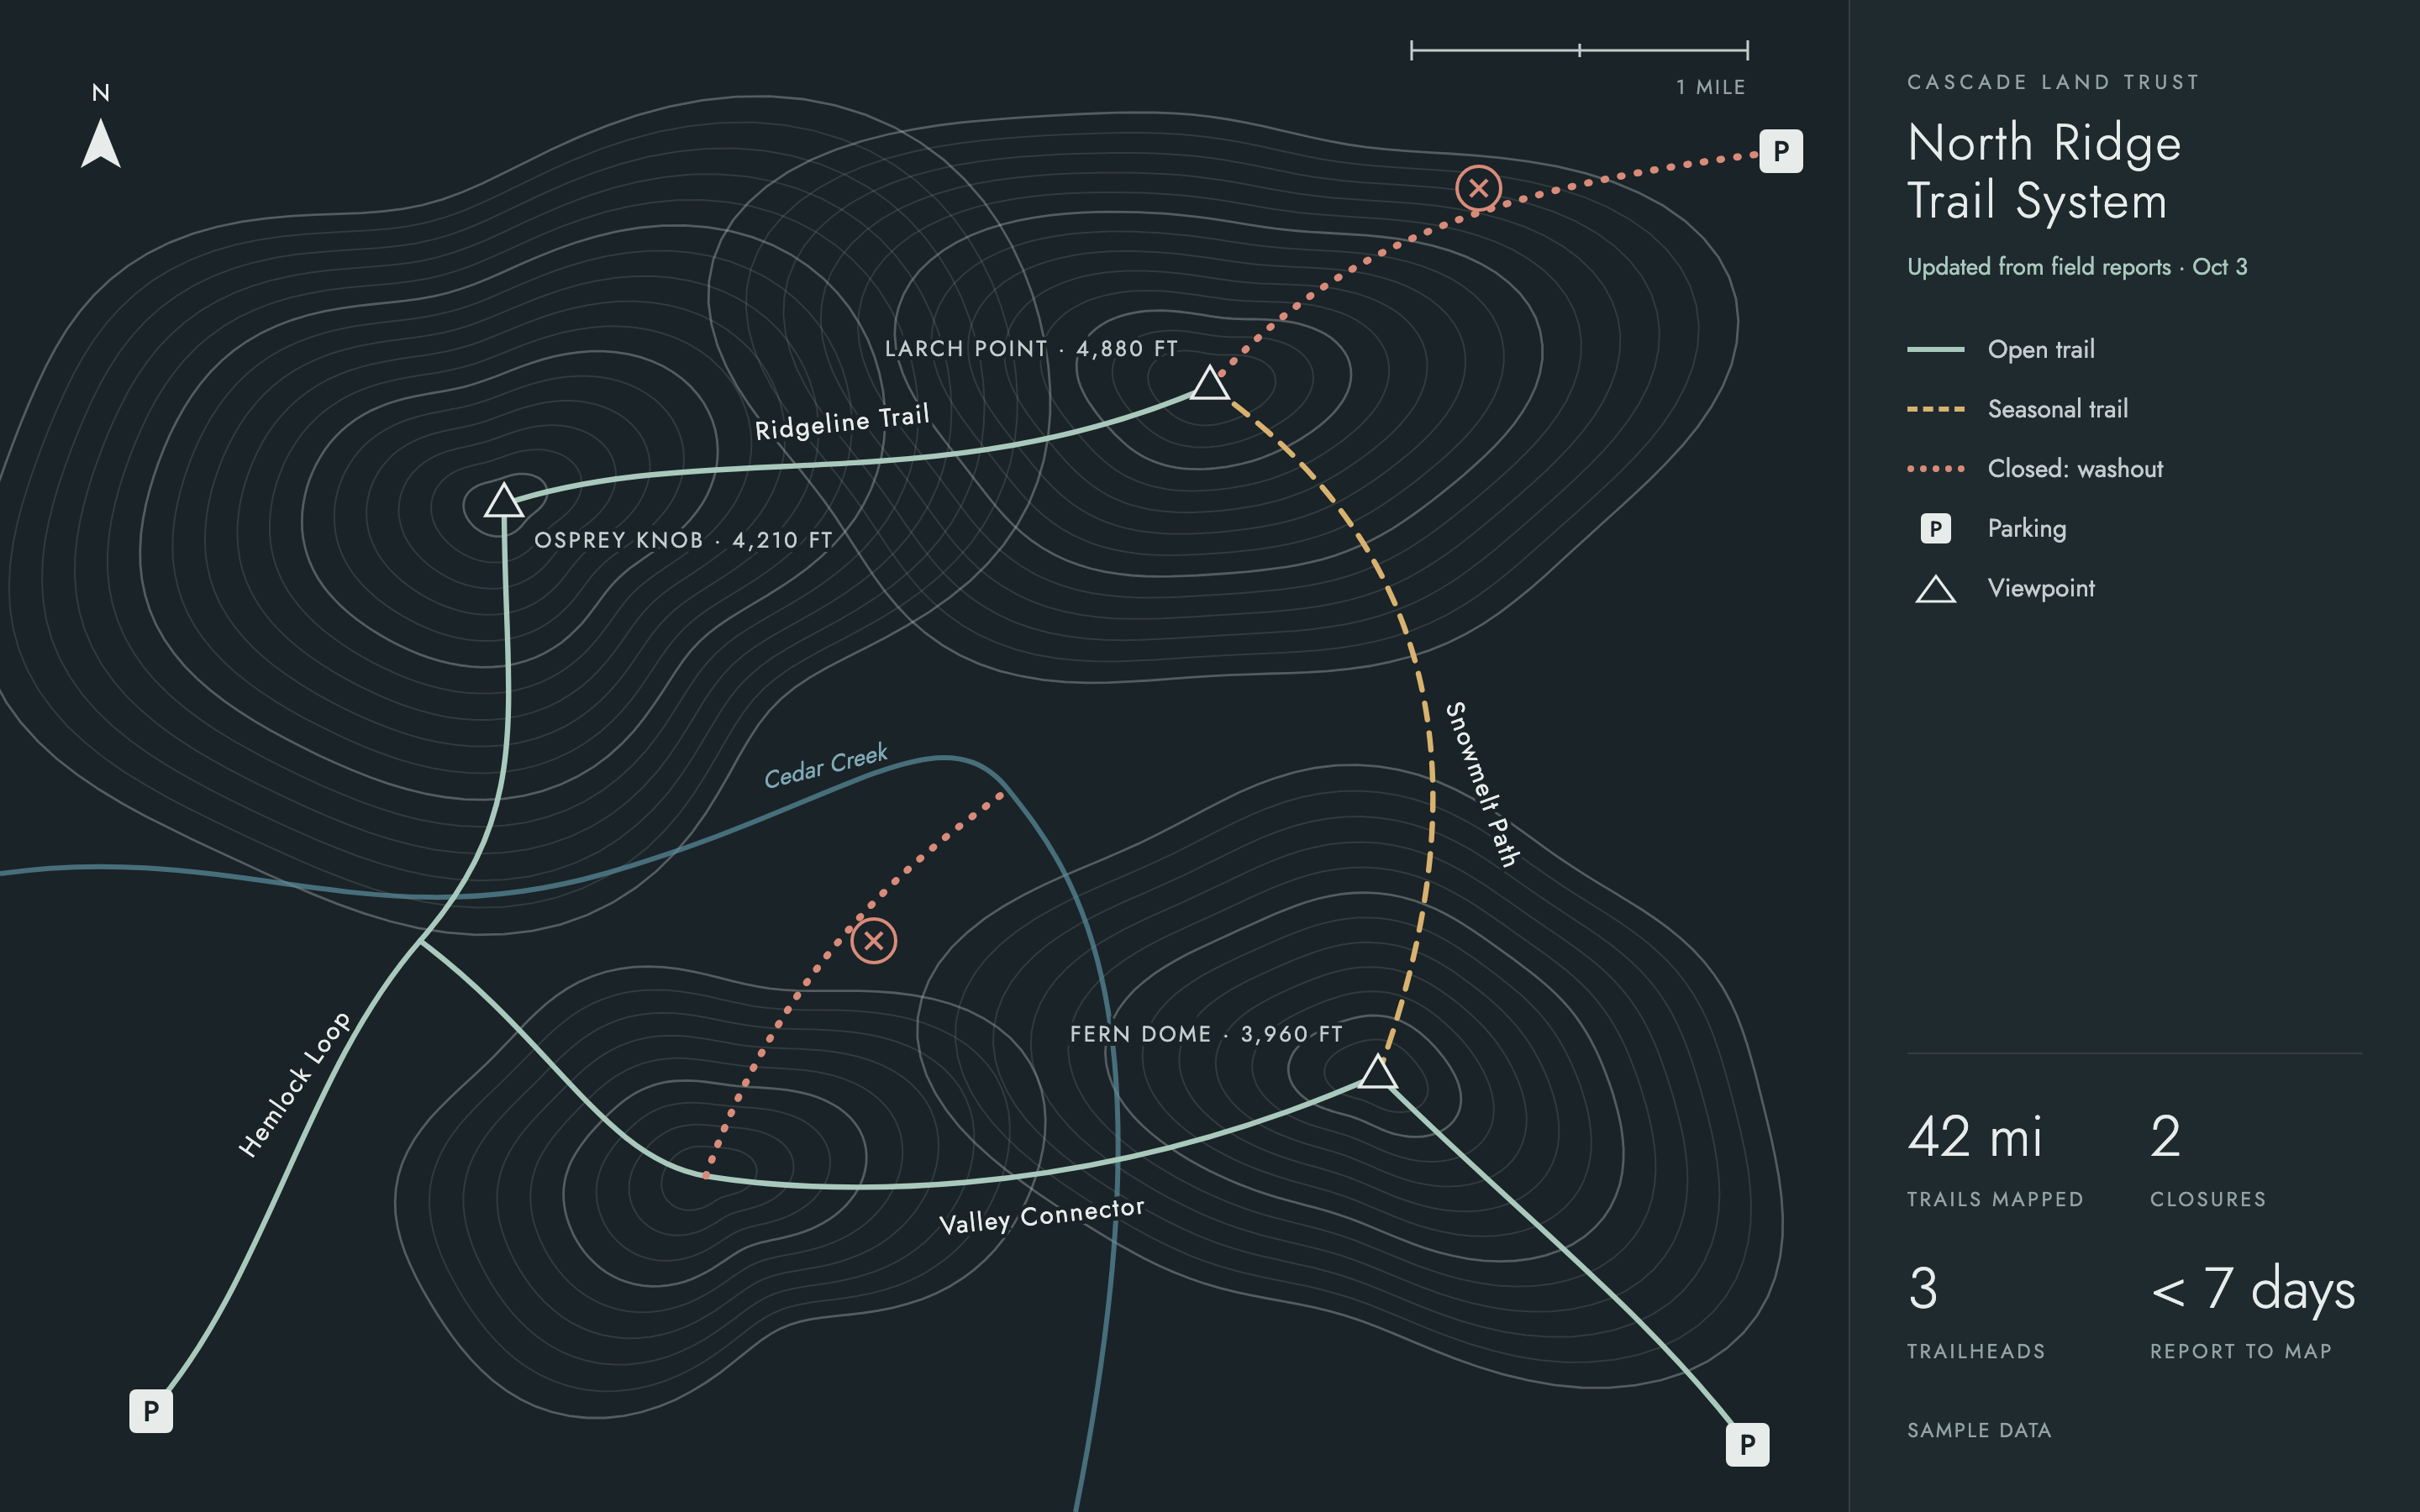
Mapped 40,000 acres of protected land and kept the public trail maps current.
Jun 2019 – Jul 2020
Field Research Assistant
University of Washington · Seattle, WA
Collected and logged stream samples at 30 sites for a two-year water quality study.
Work
Maps & measurements
A trail map from the field, the dashboard I run now, and one building before and after.
North Ridge trail mapEvery trail, closure and trailhead, updated from field reports. Sample data.Energy & carbon dashboardMonthly use across 85 sites, with the ones that need attention first. Sample data.
BeforeAfter
One building, retrofittedLighting energy room by room, before and after the LED retrofit. Drag to compare.
Projects
Selected projects
Two projects, each with the problem, the work and the result.
2025
Lighting retrofit study
Python · SQL · Power BI
The problem
Leadership wanted to cut energy use but had no way to rank 85 sites by where it would pay off.
What I built
A Python model that scored every site on age, hours and usage, checked against a 12-site pilot.
The result
The pilot cut lighting energy 18%, and the next 30 sites are scheduled by the model's ranking.
2021
Trail maps people can use
ArcGIS · Excel
The problem
The land trust's trail maps were years out of date and only existed as PDFs.
What I built
A shared GIS layer with every trail, closure and parking lot, updated from field reports.
The result
Maps are now current within a week, and visitor calls about closed trails dropped by half.
Studies
Education
Class of 2020
B.S. in Environmental Science
University of Washington
Dean's List
Contact
Let's talk.
I'm open to sustainability and analytics roles in Seattle or remote. Email is the fastest way to reach me.